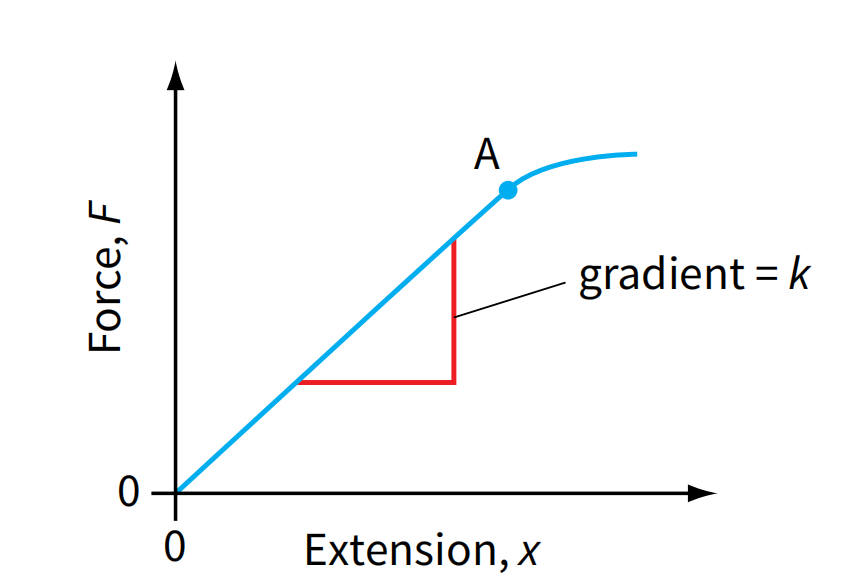
Understanding a force-extension graph
- The graph typically has force (F) on the y-axis. This is usually measured in newtons (N).
- The extension (x) is on the x-axis. This is measured in units of length). Note that the extension is the increase in length of the material, not its total length.
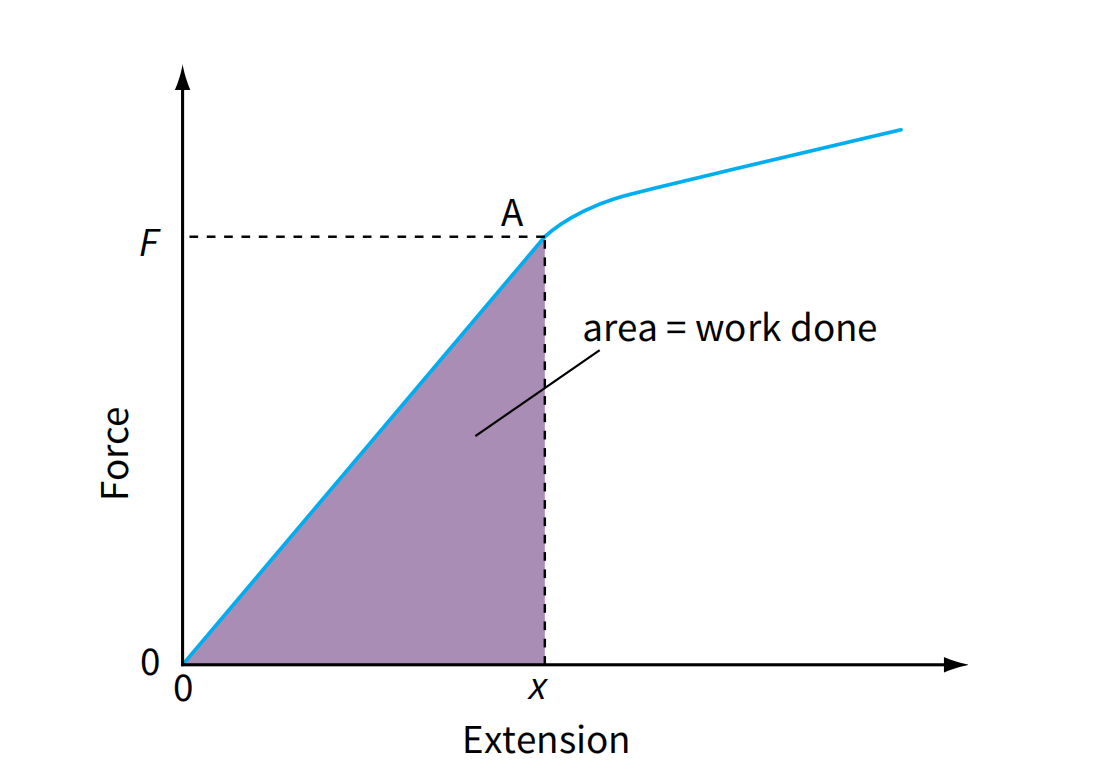
- The linear region (origin to A), represents the material obeying Hooke's Law, where F=kx.
- The gradient of this straight-line portion represents the spring constant (k). A steeper gradient indicates a stiffer material, which requires a greater force to produce the same extension.
- After the elastic limit (A), the force-extension graph curves, meaning that the extension is no longer proportional to the applied force.
- If the elastic limit is breached, the material no longer returns to its original length when the force is removed. (permanent deformation)