Understanding a P-V diagram
- A PV diagram is a graph where pressure (p) is plotted on the y-axis and volume (V) is plotted on the x-axis.
- When pressure increases/decreases but volume is constant, the temperature of the gas increases/decreases. Thermal energy is supplied to the gas/released by the gas.
- When volume increases/decreases but pressure remains constant, work is done by the gas/on the gas.
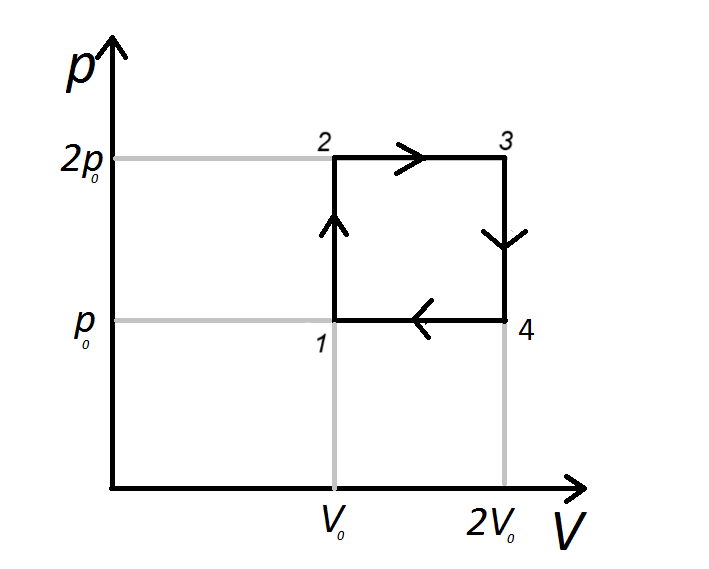
- From 1 to 2, the P increases but V is constant. Thermal energy is supplied to the gas.
- From 2 to 3, V increases but P remains the same. The gas does work. The work done is given by the equation \( W = 2p_0 (2V_0 - V_0) \)
- From 3 to 4, P decreases but V is constant. Thermal energy is released by the gas.
- From 4 to 1, V decreases but P remains the same. The work done on the gas is given by the equation \( W = 2p_0 (2V_0 - V_0) \)
- As the gas returns to the same pressure and volume in 1, the change in total energy and total work done is 0.